Features
- English
- français
- Deutsche
- Contact us
- Docs
- Login

No developer wants 3 AM urgent server outages and performance alerts, but that's exactly what can happen without solid application monitoring. Poor performance and outages directly impact your revenue.
Akamai and SOASTA’s research reveals the brutal economics of performance problems: even a mere 100ms increase in latency slashes conversion rates by 7%, while extended downtime can hemorrhage thousands of dollars hourly. This direct link between technical performance and business outcomes is precisely why your monitoring stack must evolve beyond basic tracking to become an early warning system, catching and resolving issues before they ever reach your users' screens.
Application performance monitoring means stopping issues before they start. Well-configured service level objectives (SLOs) turn potential disasters into minor fixes.
"The best time to fix a bug is before it exists." - Andrew Hunt, co-author of The Pragmatic Programmer
In this guide, we'll explore these key areas:
What hurts more than a 3 AM wake-up call, watching revenue fall after systems go down. Here's how smart monitoring stops fires before they start:
Proactive security: Don't wait for breaches to happen. Detect and block threats in real-time with continuous monitoring
Application monitoring keeps your systems honest. Three pieces work together to tell you what's happening under the hood.
These three pieces work together as your monitoring foundation, helping you catch problems early and keep everything running smoothly. You know what's great? Modern cloud platforms have made it pretty easy to set up these monitoring tools–no rocket science needed. Lets look at how in the next section.
Cloud monitoring gives you a direct line between system health and business impact. Real-time monitoring lets you catch and fix small hiccups before they snowball into big problems that affect your users. You can optimize your system based on actual performance metrics.
Modern container platforms like Kubernetes have changed how we look at data and offer granular insights into every component of our applications. You get granular insights while maintaining the full context of your system.
Modern applications are versatile and adaptable in that they use different specialized tools (called runtimes) to get various jobs done efficiently. Rust powers the heavy lifting, Node drives web API,s and Python crunches data. Each runtime needs its monitoring approach to catch problems early— think of it like having specialized doctors for different parts of your system.
| Runtime | Requests/sec | Memory Pattern | Monitoring Focus | Common Use Case |
|---|---|---|---|---|
| Rust | 690 | Static allocation | Thread metrics, memory safety | High-performance services |
| Node.js | 100 | Event-driven | Event loop, async operations | API services, real-time apps |
| Python | 50 | Reference counting | GIL contention, memory usage | Data processing, ML services |
Runtime-specific monitoring strategies:
This strategy helps maintain optimal performance across your entire application while reducing mean time to resolution when problems pop up.
{ "eventLoopLag": { "warning": 100, "critical": 500 }, "heapUsage": { "warning": "70%", "critical": "85%" } }{ "gilContentionRate": { "warning": "25%", "critical": "40%" }, "memoryGrowth": { "warning": "10MB/min", "critical": "50MB/min" } }{ "threadPoolUtilization": { "warning": "85%", "critical": "95%" }, "requestLatency": { "warning": "10ms", "critical": "50ms" } }Upsun makes working with multiple runtimes less complex by giving you visibility into your entire stack from a single place. You can define and manage dependencies between services, helping you identify potential bottlenecks. Our unified monitoring lets you track performance across all technologies.
Here are the key metrics to watch, along with their thresholds and what to do when things go wrong:
| Metric | Normal | Warning | Critical |
|---|---|---|---|
| Response Time | < 200ms | > 500ms | > 1000ms |
| Error Rate | < 0.1% | > 1% | > 5% |
Response time monitoring: Track request response speed—it's your user experience pulse.
[2025-02-13 12:15:23] [WARN] Slow query detected - Endpoint: /payment - Duration: 650ms - Query: SELECT * FROM orders WHERE user_id = ?Error rate monitoring: Track requests that fail to keep your service running smoothly.
[2025-02-13 12:30:00] [ERROR] POST /api/users - 500 Internal Server Error - Reason: Database connection failed
| Metric | Normal | Warning | Critical |
|---|---|---|---|
| CPU Usage | < 70% | > 70% (5+ min) | > 85% (2+ min) |
| Memory Usage | < 75% | > 85% | > 95% |
CPU monitoring: find performance bottlenecks early and fix them before your users notice anything's wrong.
[2025-02-13 14:20:33] [WARN] High CPU Usage - Service: API - Usage: 82%Memory monitoring: tracking memory usage finds memory leaks before they tank your app. No crashes, no surprises.
[2025-02-13 14:45:10] [WARN] Memory Pressure - Service: BackgroundJobProcessor - Heap Usage: 90%Disk I/O monitoring: Monitor both how fast your storage can handle operations (IOPS) and how much data it can move at once (throughput) to keep things running well.
Availability tracking: Define measurable SLOs that quantify your service performance. Track latency, error rates, and uptime.
[2025-02-13 15:00:00] [LOG] SLO breach detected - Error budget: 92% - Region: US-East - Status: Initiating capacity analysisPerformance SLOs: Define response time targets that match what users expect and keep measuring against them.
[2025-02-13 16:10:22] [WARN] Slow Page Load - URL: /products - Average Load Time: 4.2s[2025-02-13 16:30:45] [WARN] Cart Abandonment Spike - User Journey: Checkout - Completion Rate: 88%Track these user-focused metrics consistently and take swift action when warning signs appear; you'll keep solid service delivery and prevent user frustration. When you combine these insights with your system monitoring and logging, you get an observability picture for both technical excellence and business success. With this foundation, let's explore how to protect your systems in real-time with robust security monitoring.
Security monitoring works alongside performance tracking to shield your systems from threats. Here's your practical security toolkit:
Scan security events every 30 seconds to spot attack patterns in real-time - your first defense against emerging threats
| Attack Type | Detection Method | Response |
|---|---|---|
| Credential abuse | Login velocity per IP | Progressive rate limiting |
| Data theft | Unusual data patterns | Network isolation |
Response time targets:
| Threat type | Response time | Action required |
|---|---|---|
| Brute force | < 5 min | Block IPs, alert security |
| Data breach | < 15 min | Isolate affected systems |
| DDoS | < 10 min | Scale defenses, filter traffic |
| Zero-day | < 30 min | Patch and update systems |
Your application's technical metrics directly impact your bottom line. Here's how to translate performance data into business value:
| Metric | Normal | Warning | Critical | Action |
|---|---|---|---|---|
| Transaction Success | ≥99% | 98-99% | <95% | Check payment systems, API health |
| Revenue Loss | $0 | $1-5K/hr | >$10K/hr | Activate incident response |
Response matrix for transaction issues:
Key takeaway: Track these metrics in real-time and adjust thresholds based on your business patterns. Quick response to degradation prevents a major revenue impact.
Every event, error, and user action gets captured in logs, giving you the complete story when things go wrong. They're your first line of defense for production issues.
Why structured logs matter
What this means for you:
DEBUG: Dev-only details (keep out of prod)INFO: Normal system eventsWARN: Problems that need attentionERROR: Recoverable failuresCRITICAL: Drop everything and fix nowrequest_id: Link events across servicestimestamp: UTC for global trackinguser_id: Who triggered thisservice_name: Where it happenedlog_level: How urgent is itExample: structured logging in Python
`import logging import json
logger = logging.getLogger(name)
def process_order(order_id, user_id, product_name, quantity): logger.info("Processing order", extra={ "order_id": order_id, "user_id": user_id, "product_name": product_name, "quantity": quantity, "event_type": "order_processing" # Adding context for analysis }) try: # ... order processing logic ... logger.info("Order processed successfully", extra={ "order_id": order_id, "status": "success", "event_type": "order_completion" }) except Exception as e: logger.error("Error processing order", extra={ "order_id": order_id, "error_message": str(e), "event_type": "order_error" }, exc_info=True) # Include stack trace for errors raise
Example usage
process_order("ORD-12345", "user-42", "Awesome Widget", 2)`
Example log output (JSON):
{"asctime": "2025-02-13 18:00:00", "levelname": "INFO", "name": "__main__", "message": "Processing order", "order_id": "ORD-12345", "user_id": "user-42", "product_name": "Awesome Widget", "quantity": 2, "event_type": "order_processing"} {"asctime": "2025-02-13 18:00:01", "levelname": "INFO", "name": "__main__", "message": "Order processed successfully", "order_id": "ORD-12345", "status": "success", "event_type": "order_completion"}
When you need structured logging in other programming languages, here are some solid options:
Each of these libraries provides a consistent way to capture what your code does as it runs.
When requests flow through multiple services, you need clear insights into what happens where. OpenTelemetry makes this simple by linking your components together so you can find and fix issues quickly.
from opentelemetry import trace
from opentelemetry.trace import Status

tracer = trace.get_tracer(__name__)

@tracer.start_as_current_span("process_order")
def process_order(order_id):
    with tracer.start_span("validate_order") as span:
        # Add business context
        span.set_attribute("order_id", order_id)

        if not is_valid(order_id):
            span.set_status(Status.ERROR)
            return False

    return True
Traces show you exactly what's happening when things go wrong across your system helping you find and fix issues faster.
Your choice of monitoring tools directly determines how well you’re able to detect and resolve issues. Here's a clear and practical guide to picking tools that work for your stack.
Quick setup, full visibility
For the control enthusiasts
Ideal when you're all-in on one cloud
| Feature | SaaS APM | Open Source | Platform-Native |
|---|---|---|---|
| Setup | Quick (Datadog, Sentry) | Complex (Prometheus + Grafana) | Built-in (AWS CloudWatch) |
| Control | Limited | Full | Platform-based |
| Scale | Automatic | Manual | Platform-tied |
| Cost | Usage-based | Infrastructure + Maintenance | Platform-included |
| Maintenance | Managed | Self-managed | Platform-managed |
| Integration | Pre-built connectors | Custom implementation | Native tools |
| Best For | Fast deployment | Complete flexibility | Platform alignment |
Tip: Mix tools based on what you monitor. Use SaaS APM for core metrics plus specialized tools for specific needs.
Pick your monitoring stack based on what matters most:
Now that we've covered monitoring tools, let's put that data to work. Here's how to transform metrics into automated actions:
Configure smart alerts that turn data into action:
Response time > 500ms (5min)
actions:
Error rate > 1% (1min)
actions:
CPU load > 80% (3min)
actions:
Health check failures
actions:
Let's implement automated monitoring workflows:
# Alert configuration example
alerts:
  - name: "High API Response Time"
    metric: "http_request_duration_seconds_p95"
    threshold: 500ms
    duration: "5m"
    severity: "warning"
    route_to: "dev-team-channel"
    notification_type: "slack"

  - name: "Critical Service Down"
    metric: "service_health_check_failed"
    service: "payment-service"
    severity: "critical"
    route_to: "on-call-pager"
    notification_type: "pagerduty"
    actions:
      - "auto_restart_service"
      - "create_jira_ticket"
With automation and smart alerts in place, let's create focused dashboards get into critical insights. Here's what we're working with:
Effective monitoring lets you detect and resolve technical issues before they impact your users.
Track key metrics:
Monthly Cost = (Data Points × Storage Time) + (Log Volume × Rate) + (Query Usage × Price)
Like the applications they track, monitoring systems need to grow and adapt over time. Static monitoring setups quickly become outdated as your architecture evolves, new services are added, and business priorities shift. Exceptional monitoring isn't a one-time implementation—it's an ongoing practice that continually delivers increasing value.
Set a quarterly cadence to evaluate your entire observability approach, examining which metrics provide actionable insights and which generate noise. This consistent review cycle ensures your monitoring tools detect the issues that matter most to your current architecture and business goals, rather than solving yesterday's problems.
The most mature engineering organizations treat their monitoring configurations with the same care as application code—versioned, tested, and continuously improved. By approaching monitoring as a living system rather than a static setup, you'll build observability that remains relevant and valuable even as your technical setup transforms.
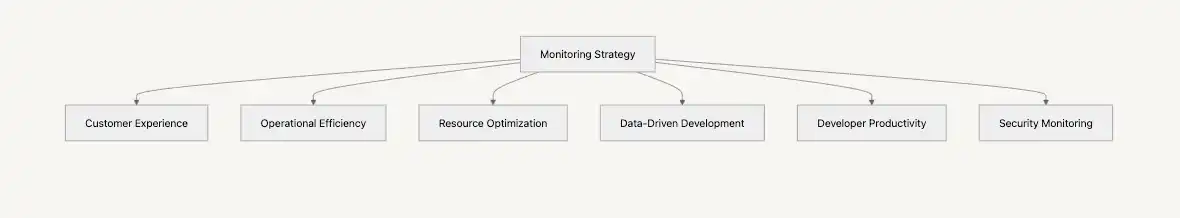
Let's build your monitoring strategy based on your application's needs. Start with these foundational steps:
Let's explore how monitoring evolves to support your needs:
| Level | Monitoring Capability | Business Impact |
|---|---|---|
| 1 | Basic metrics & logs | Faster incident response |
| 2 | Structured monitoring | Proactive issue prevention |
| 3 | Auto-remediation | 99.99% uptime |
| 4 | Predictive analytics | Zero-impact changes |
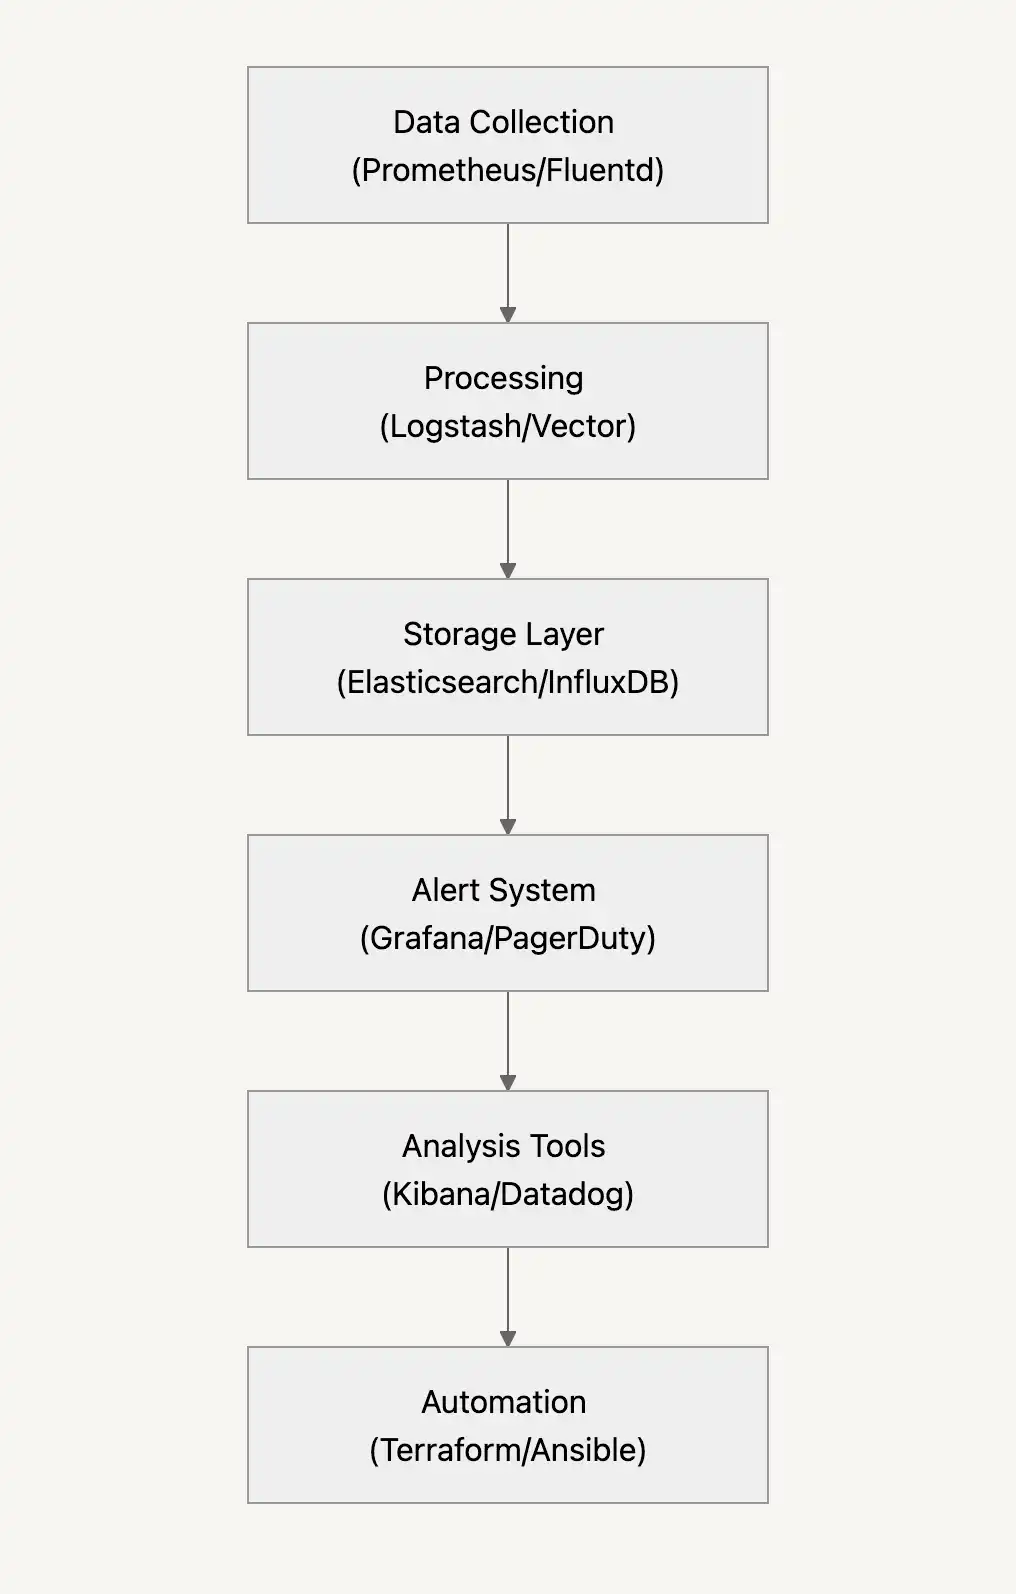
How monitoring flows
Reliable monitoring systems need a few key elements:
What you should think about for monitoring data:
Here's what to track to make your systems scale well:
Every small improvement takes you closer to a monitoring system that prevents issues rather than just reacting to them. Build it step by step and watch those late-night alerts become a thing of the past.
Join our monthly newsletter
Compliant and validated