


Git’s getting fit: making our project API faster with the Blackfire profiler


Upsun has a unique architecture. One of the most interesting aspects of that architecture is that, while some of our APIs are multi-tenant, our most important API—the one controlling each project and its environments—is actually a single-tenant daemon.
Even more interestingly, this single-tenant daemon is a multi-protocol API within which the main API speaks Git. It also exposes a REST API which in turn exposes all of its Git capabilities and augments them with some others like answering the command to map a domain name to an environment, configuring access permissions, or scaling up a container in a preview environment. Essentially, any change to a running cluster happens through the custom daemon.
What’s so good about a single-tenant daemon?
When we say single-tenant, we mean that every Upsun customer project has its own fully-isolated daemon. Each with its own datastore which contains absolutely everything the project needs to run—all from one place.
This provides a whole variety of benefits for our users. Including reducing the fault zones to the extreme, allowing the movement of projects between regions, and enabling continuous deployment of new features. All with no risk as a performance issue in one project, cannot affect another, thanks to this architecture. And even better, Git is not in the request path of a running application; meaning it could be down and the configured clusters will continue to run without a problem.
How to monitor performance with single-tenant apps?
We’ve said a lot of good things about single-tenant applications, but there are some difficulties to consider, particularly concerning performance observability and optimization. After all, a project with hundreds of branches and a deep history will behave quite differently from a project with a single commit. So, if you don’t determine a way to prioritize performance optimization work, it's easy to let this important, but not necessarily critical component, fall to the wayside and allow your application performance to gradually get slower and slower. All production applications need observability, and as systems grow more complex, the demand for performance insights deepens.
While many engineers see observability as merely traces, logs, or metrics, its essence is in querying the system and delving deeper into potential bottlenecks or areas for optimization. Consider this: an engineer should seamlessly shift from wondering, "Which endpoints lag?" to querying, "What occurs within the code during the slowest 1% of HTTP requests, or what is unique about these slowest instances, endpoints, or even users?" Genuine observability offers both depth and breadth—especially when using a powerful observability tool, like Blackfire
Enter Blackfire, the monitoring and profiling expert
Blackfire supports both application monitoring and profiling to maximize performance insights and optimization. Monitoring refers to an overview of system metrics: HTTP status, request delays (P50 and P99), top transactions, response times, and memory metrics, all organized by HTTP attributes and time. Blackfire profiling, on the other hand, is all about on-demand application analysis. To activate profiling, all you need is a specific HTTP header or manual code instrumentation. And as Blackfire was created to be a powerful profiling tool, it excels at visualizing data, take a look here:

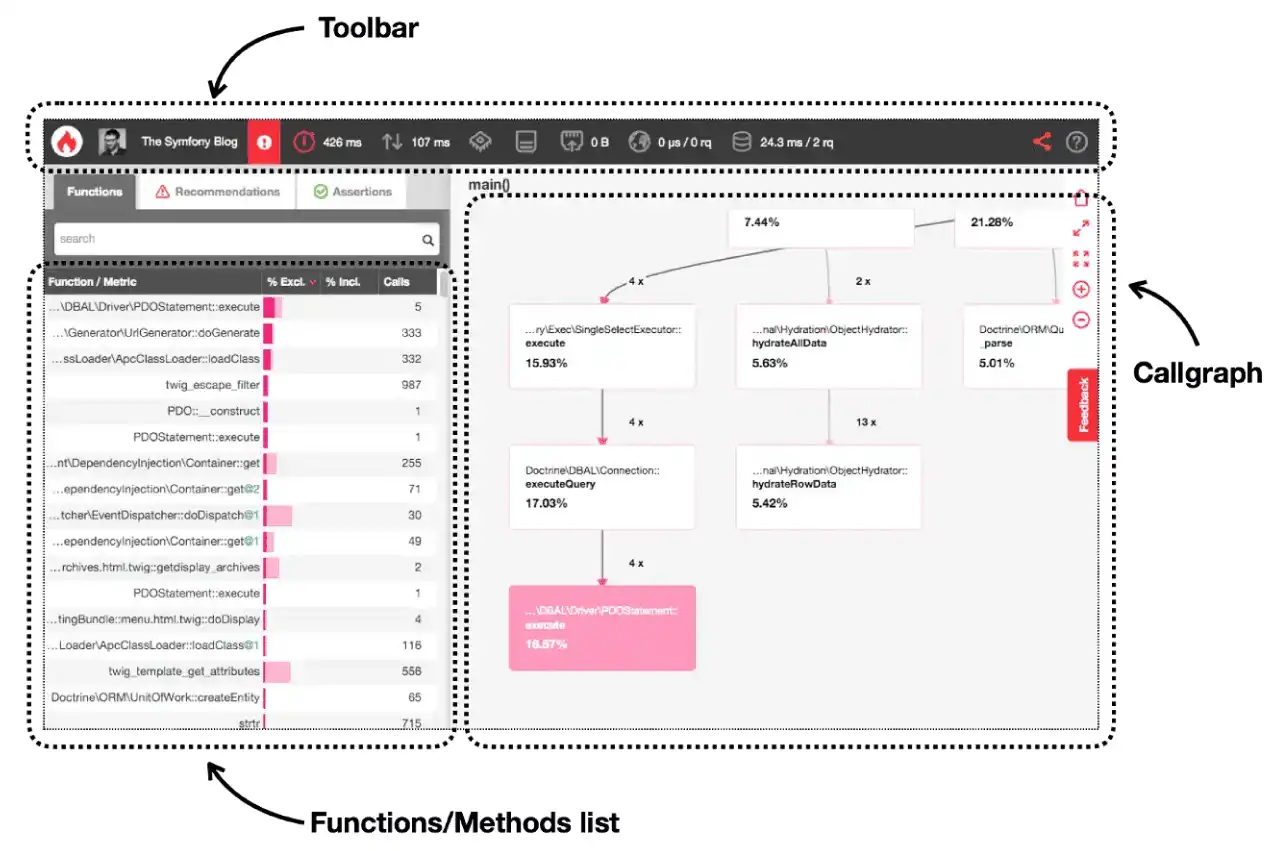
Above is a traditional callgraph visualization, which shows the graph representation of all caller-callee relationships. While timeline, on the other hand, shows the function calls that happened during profiling on a time axis.

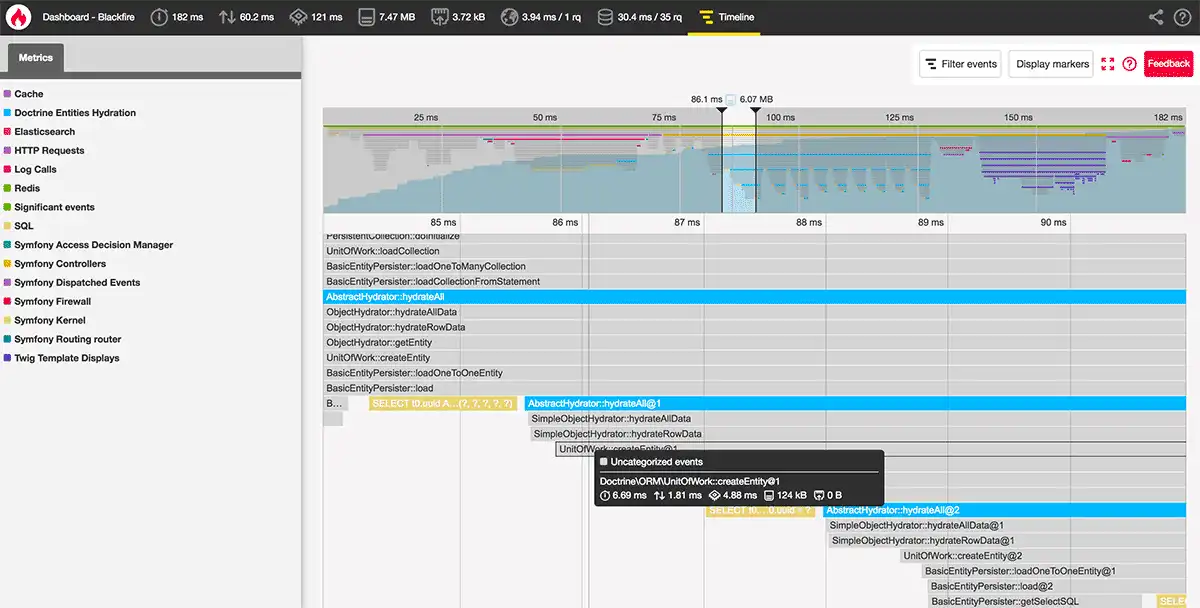
As you can see, Blackfire presents wall/time, CPU usage, and memory in a single profile. Allowing you to see a function's wall/CPU time and memory use—even network data in certain languages—in a single profiling session. Thanks to its deterministic profiler—which makes measurements when a certain event like a function call, function leave, or an exception happens—there is some overhead, but nonetheless Blackfire delivers unparalleled profiling depth. Learn more about Upsun and Blackfire profiling features.
Using both Blackfire monitoring and profiling simultaneously offers continuous opportunities to identify and address bottlenecks. Monitoring highlights system areas with the most time lags, while profiling lets us delve deep into those emerging, yet-to-be-explored bottlenecks, providing a powerful mix for superior performance.
Dogfooding and implementing the Git service
We take dogfooding very seriously. By using our own tools, we catch issues before they reach our users and continuously improve our offerings. Being able to self-test is a unique advantage for observability tools, and at Upsun, we fully embrace this—it's a beneficial cycle. For instance, we consistently test every service we provide, regardless of size.
Git sits at the heart of Upsun's user interactions. Whether it's environment setup or code deployment, Git built on Python's Pyramid framework plays a crucial role in our workflow. And given Blackfire's Python capabilities, coupling it with Git was an intuitive decision.
Our internal Git group fashioned a WSGI middleware for seamless Blackfire interaction. As of version 1.17.0, Blackfire natively supports Pyramid, streamlining integration. But how exactly do you integrate Blackfire with Git? It all starts with this command:
blackfire-python gunicorn --workers=2 test:appThis command ensures seamless integration with supported frameworks, just ensure you're equipped with a valid Blackfire environment and the right credentials. Then once you’ve configured our Git service's internal environment and activated monitoring, our dashboard will be displayed, like this:

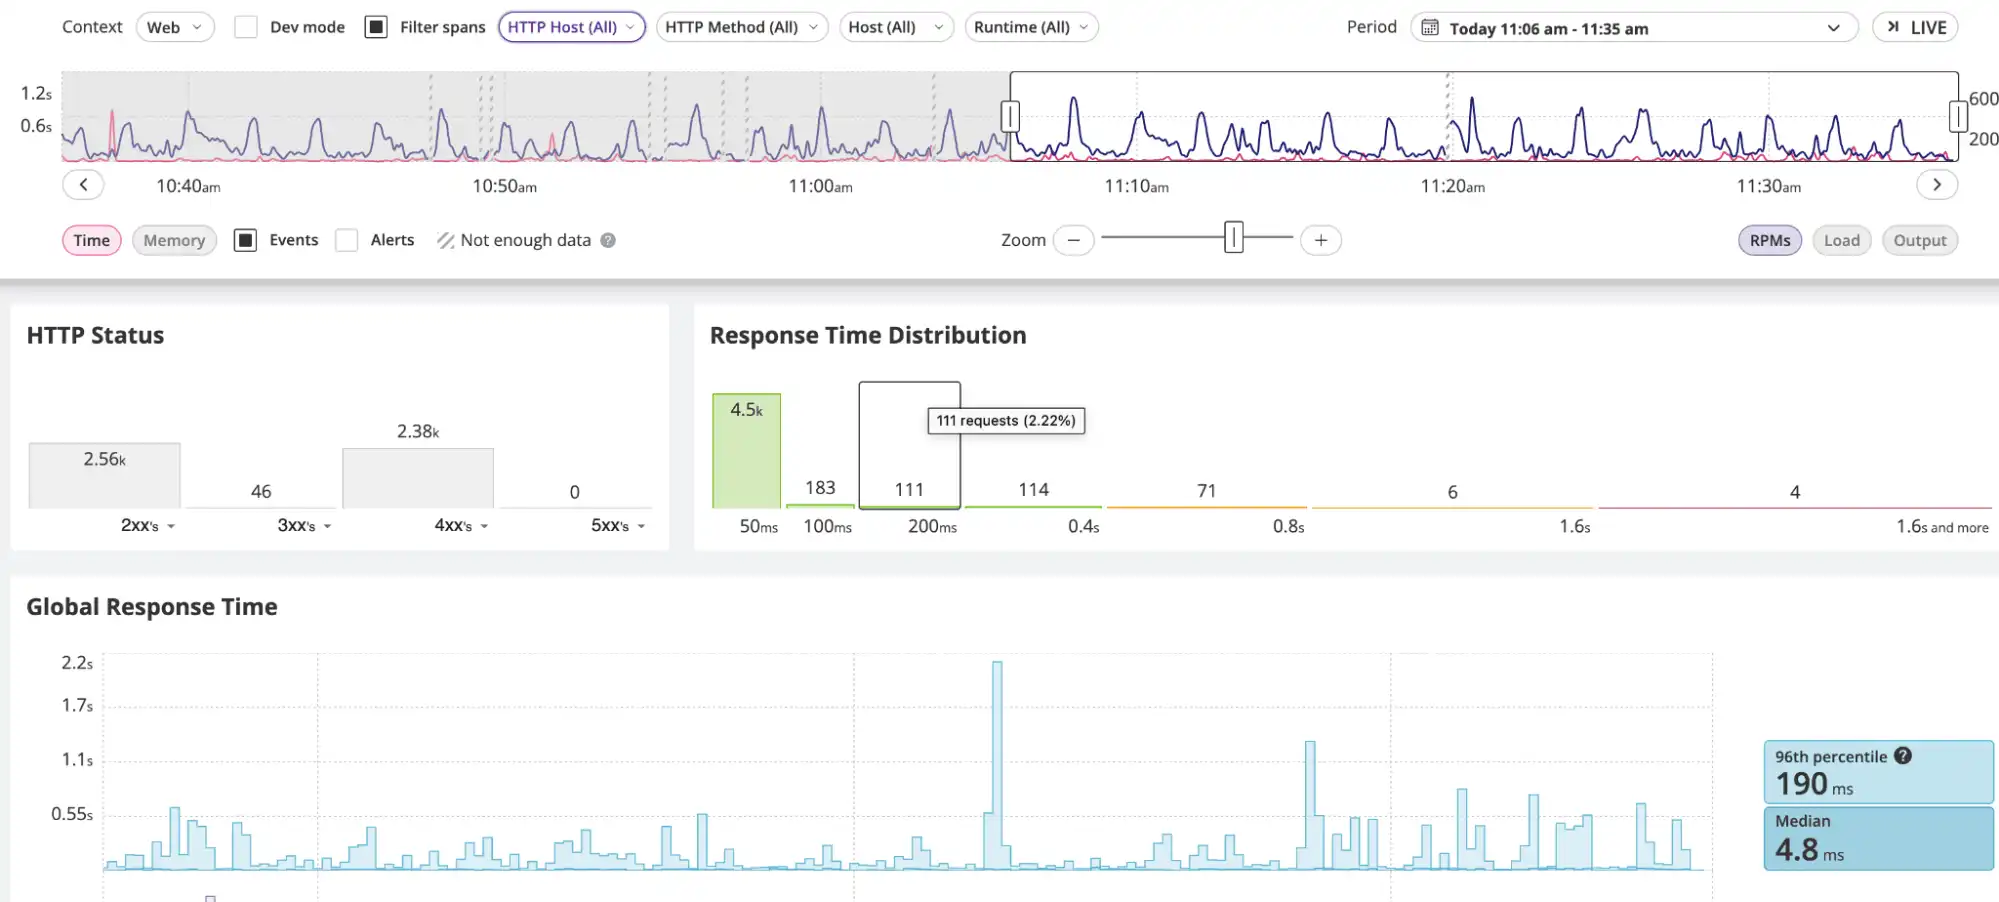
From looking at this data snapshot above, it's evident that the majority of our Git commands hover around 50ms which is a good sign. Yet, we can still focus our attention on those four requests exceeding 1.6s as they represent our system's slowest transactions. A prime example of how Blackfire observability can highlight areas for optimization—but the solution to this particular optimization find isn’t the topic for today.
Performance optimization in action
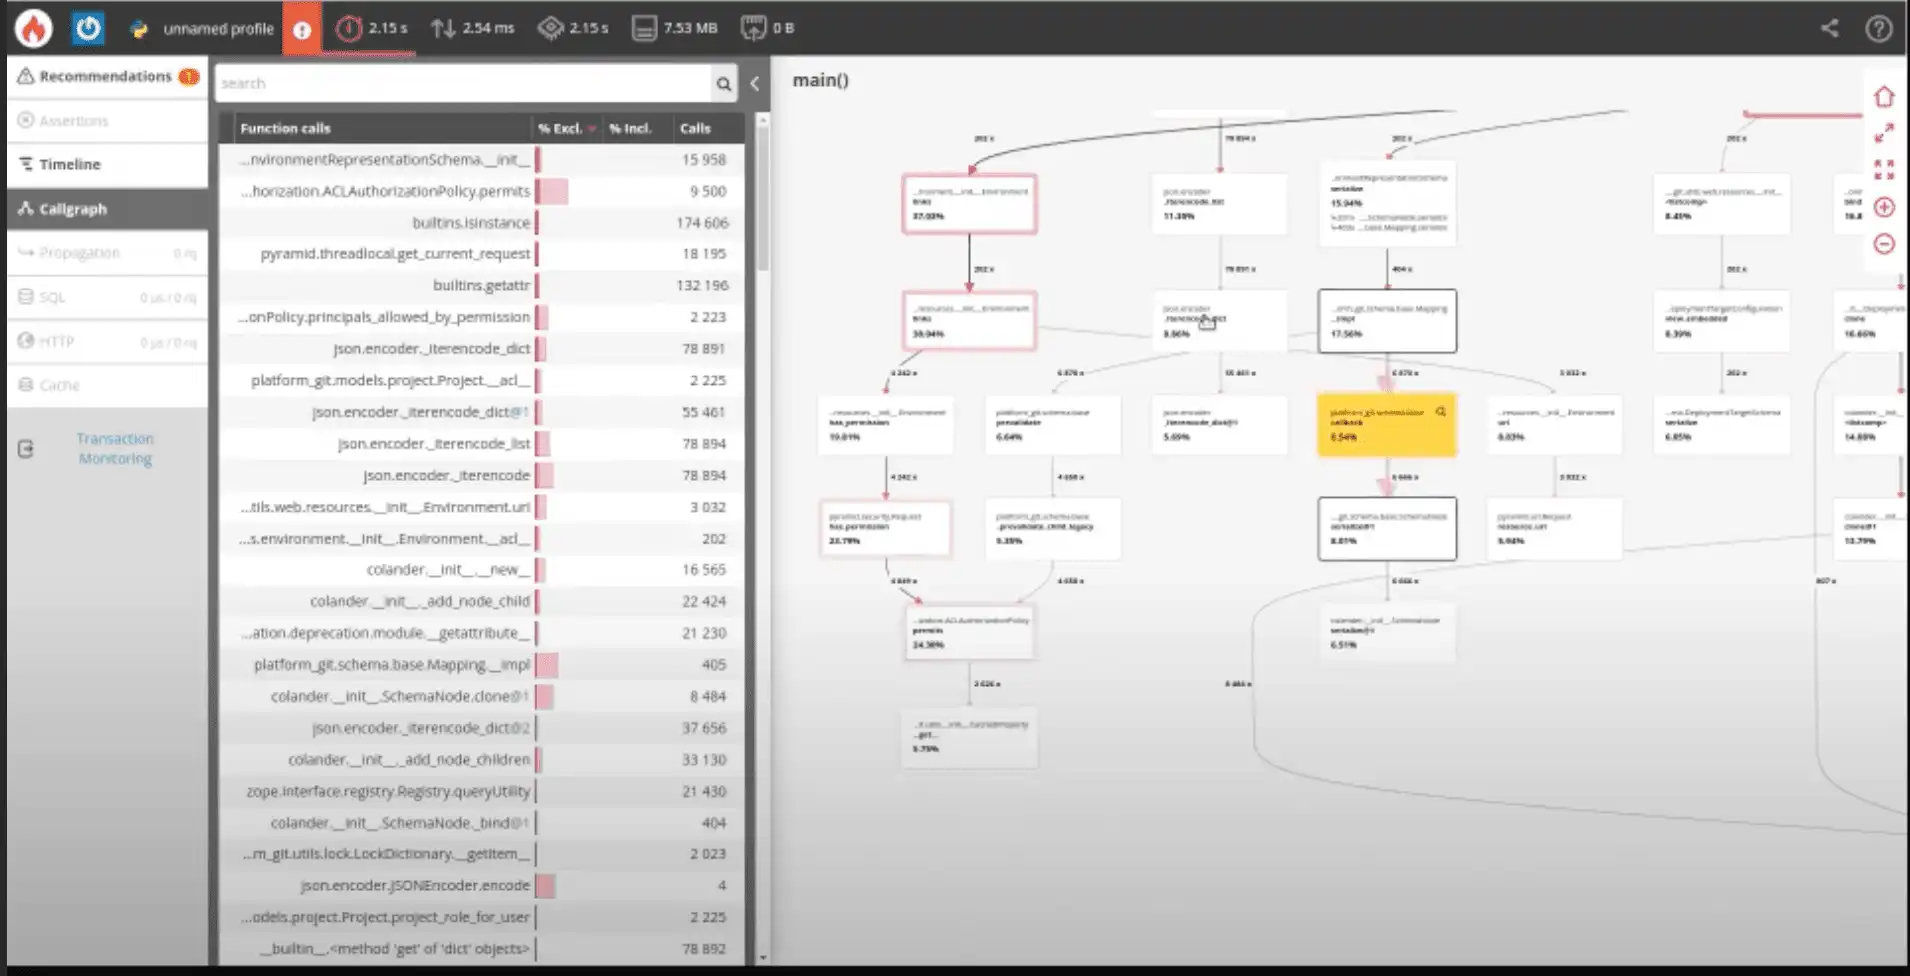
Our internal Git group pinpointed several performance issues occurring uniquely in certain environments. The exact nature of these environments remained unknown, making local reproduction challenging. This is where Blackfire's on-demand profiling proved invaluable. The team profiled specific HTTP requests and then analyzed the results with Blackfire. Below is a screenshot of the profiling of a slow Git endpoint:

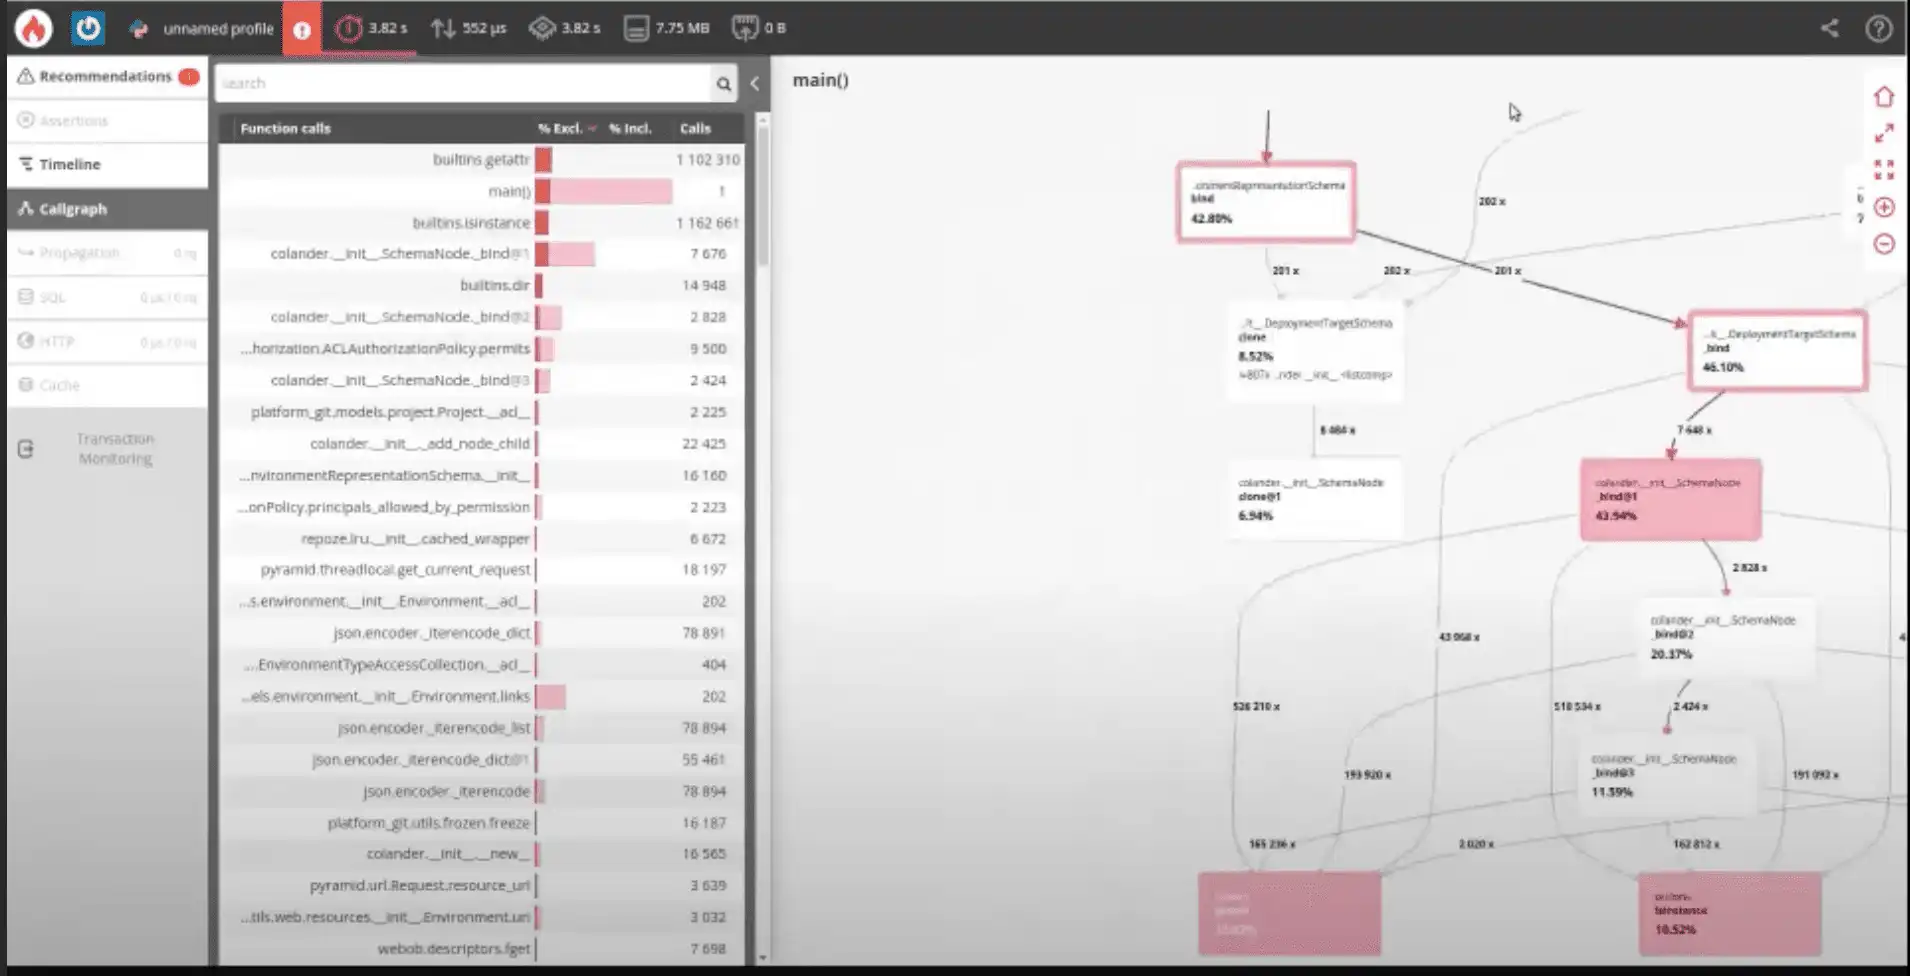
A quick glance at the top metrics reveals equal wall time and CPU time, suggesting a CPU-intensive process within the application. In contrast, if the bottleneck were I/O-based, like a laggy microservice call or extensive file read, wall time would mirror the I/O time.
Diving deeper, Blackfire's callgraph visualization identifies performance drags by highlighting the most time-consuming call chain in red, indicating the critical path. This path showcases functions ripe for optimization. The Git team's analysis exposed a redundant function in this critical path, processing a large array and conducting unnecessary isinstance checks. Eliminating this redundant function resulted in ~40% faster execution time.
With this optimization, the callgraph no longer displays a critical path, meaning no obvious areas for immediate performance improvements remain. In other words, this means further optimizations are possible, but the returns might be less fruitful.
Wrapping-up Blackfire profiling
Blackfire allows us to easily focus on low-hanging fruit optimizations, but it doesn’t need to stop there. With integrated profiling and monitoring, you can identify various bottlenecks in production systems, addressing them only when the fixes are easy to implement and cost-effective.
You might be amazed at the opportunities you miss with a tool like Blackfire, especially with legacy production code that previously lacked monitoring capabilities. Find out more details on our observability features or start a free trial today.
Your greatest work
is just on the horizon

Join our monthly newsletter
Compliant and validated