


TL;DR
|
Autoscaling is a way of matching an app's capacity to its traffic automatically. When demand rises, the system adds resources, usually more copies of the app, and when demand falls, it takes them away again.
Without it, teams either pay for enough capacity to handle their busiest hour all day long, or risk slowdowns and errors when traffic jumps. This guide explains how autoscaling decides when to act, which settings control it, and the mistakes that make it misbehave. For the difference between adding servers and making them bigger, see our guide Horizontal vs vertical scaling explained.
How autoscaling works
Key takeaway: autoscaling is a loop. It measures how busy the app is, decides whether that's too high or too low, changes capacity if needed, and waits before checking again.

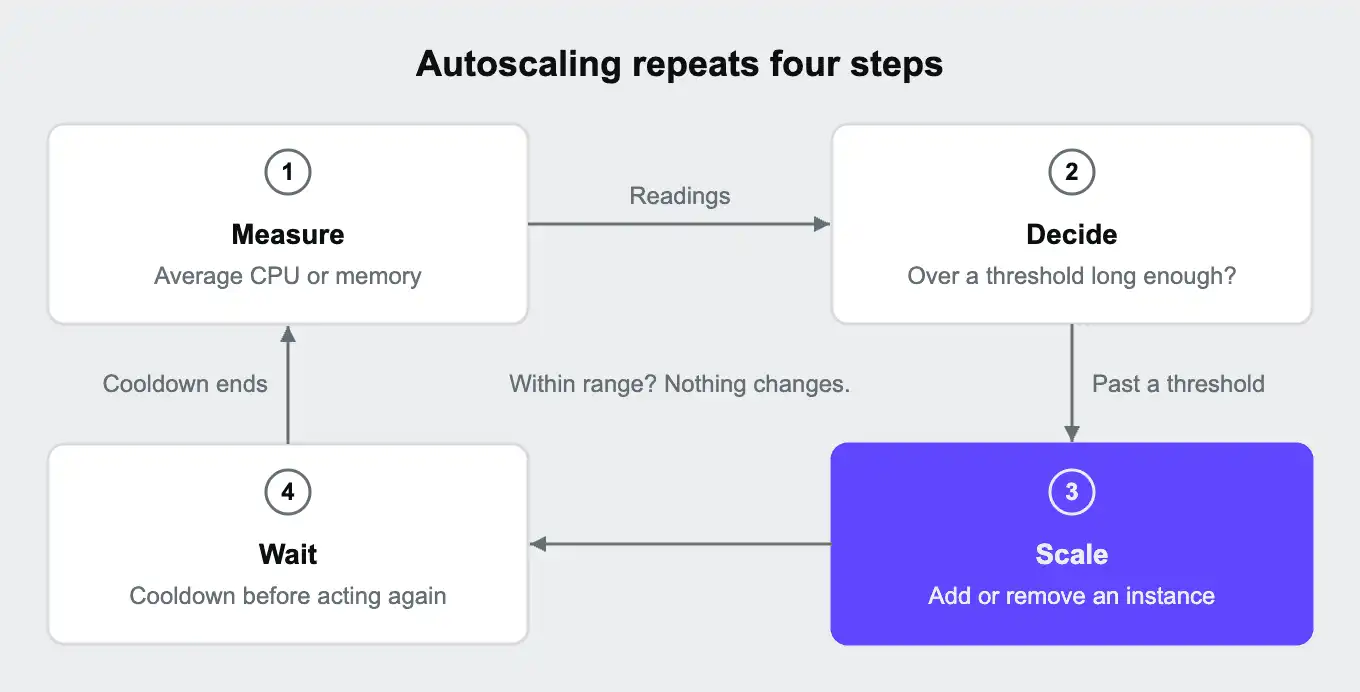
- Measure. The system collects a signal from the running app, most often average CPU or memory use across all its copies.
- Decide. It compares the signal with two thresholds: an upper one that means "too busy" and a lower one that means "mostly idle". To avoid reacting to a single blip, the signal usually has to stay past a threshold for a set time.
- Scale. If the upper threshold was crossed, it adds capacity, typically one more copy of the app. If the lower one was crossed, it removes some.
- Wait. After any change, it pauses for a cooldown period so the new capacity can take effect before it measures again.
If the signal stays between the two thresholds, nothing changes and the loop keeps watching.
Here's how that might look for an online shop during a flash sale. Two copies of the app are running at 40% CPU. The sale starts, traffic jumps, and CPU climbs past the upper threshold and stays there, so a third copy starts and the load spreads across three. When the sale ends and CPU falls below the lower threshold for long enough, autoscaling removes a copy again, one step at a time.
The settings that control autoscaling
Key takeaway: five settings decide how autoscaling behaves. Badly set, they make an app scale too late, too often, or too far.
| Setting | What it controls | If it's set too low | If it's set too high |
|---|---|---|---|
| Scale-up threshold | How busy the app must get before capacity is added | Capacity is added for small bumps, which costs more | The app is already struggling by the time help arrives |
| Scale-down threshold | How idle the app must be before capacity is removed | Extra capacity lingers long after traffic drops | Capacity is removed too early and has to be added back |
| Evaluation period | How long the signal must stay past a threshold before acting | Short spikes trigger scaling that wasn't needed | The app reacts slowly to real surges |
| Cooldown window | How long to wait after a change before making another | The system adds and removes copies in quick succession | It can't respond to a second surge soon enough |
| Minimum and maximum instances | The fewest and most copies that can run | A low minimum leaves too little for normal traffic, and a low maximum caps capacity when you need it | A high minimum pays for idle copies, and a high maximum risks a large bill if something goes wrong |
Keep a clear gap between the two thresholds, so the system isn't constantly hovering near both. And set the minimum high enough to handle normal traffic on its own, so autoscaling only has to deal with the peaks.
Types of autoscaling
Key takeaway: reactive horizontal autoscaling adds copies when load rises. Scheduled and predictive scaling add capacity ahead of time instead of waiting for load.
| Type | How it works | Good for | Watch out for |
|---|---|---|---|
| Horizontal (reactive) | Adds or removes copies of an app when a signal crosses a threshold | Web apps, APIs, and background workers with changing traffic | The app must be able to run as several copies |
| Vertical | Gives an existing server or container more or less CPU and memory | Workloads that can't easily run as several copies | Resizing can require a restart, and every server has a maximum size |
| Scheduled | Changes capacity at set times, such as before business hours | Peaks you can see coming, like a weekly newsletter send | Doesn't help with surprises |
| Predictive | Forecasts demand from past patterns and adds capacity before it's needed | Regular daily or weekly cycles | Depends on history being a good guide to the future |
These can be combined. A team might schedule extra capacity before a planned launch and let reactive autoscaling handle anything beyond it. Our guide Horizontal vs vertical scaling explained covers the first two types in more depth.
What to scale on
Key takeaway: scale on the signal that actually rises when your app is under strain. CPU suits many web apps, while queue length usually suits background workers.
If the signal autoscaling watches doesn't rise when users start waiting, autoscaling won't help them.
| Signal | What it measures | Works well for | Limitations |
|---|---|---|---|
| CPU use | How hard the app's processors are working | Apps whose work is mostly computing, such as rendering pages or running business logic | Misses slowdowns caused by waiting on a database or an outside service |
| Memory use | How much memory the app is holding | Apps that keep a lot of data in memory, such as caches or data processing | Systems often use spare memory for caching, so high readings can be normal |
| Requests or response time | How much traffic arrives, or how long answers take | Matching capacity directly to what users experience | Not offered by every platform |
| Queue length | How many jobs are waiting to be processed | Background workers handling emails, imports, or reports | Only applies to work that goes through a queue |
If you're not sure, start with CPU, watch how the app behaves during a real peak, and adjust. Profiling the app first shows whether it runs out of CPU, memory, or something else entirely, such as database connections.
Common autoscaling pitfalls
Key takeaway: autoscaling adds copies of whatever you scale. If the real bottleneck is somewhere else, usually the database, more copies won't help and can make things worse.
| Pitfall | What happens | How to avoid it |
|---|---|---|
| The database becomes the bottleneck | More app copies send more queries and open more connections, until the database is overwhelmed | Scale the database too, with read replicas, caching, or connection pooling |
| Scaling on the wrong signal | Users wait while the measured signal stays calm, so nothing scales | Pick the signal that rises when the app is under strain, and test it during a real peak |
| New copies start too slowly | A copy that takes minutes to start arrives after the spike has peaked | Keep startup fast, set a sensible minimum, and scale up earlier with a lower threshold |
| Constant up and down | Thresholds set too close together make the system add and remove copies repeatedly | Leave a wide gap between thresholds and use a cooldown window |
| Unexpected costs | A bug, a bot, or an attack drives usage up and autoscaling follows it | Set a sensible maximum and an alert when scaling happens |
| Work cut off during scale-down | A copy is removed while it's still handling requests or jobs | Make sure the app finishes or hands off work when told to shut down |
| The app isn't ready for several copies | Sessions or files stored in one copy are missing from the others | Store sessions and files in shared places before turning autoscaling on |
Autoscaling only the app layer moves the bottleneck down to the database.
Autoscaling on Upsun Cloud
Key takeaway: Upsun Cloud autoscales the whole stack the same way: apps, background workers, and PostgreSQL or MariaDB read replicas, each based on CPU or memory use.
On Upsun Cloud, autoscaling is horizontal. It adds or removes whole instances, and it covers three layers:
| Layer | What scales | What it handles |
|---|---|---|
| Apps | Instances of a web app | Incoming web traffic |
| Workers | Instances of a background worker | Jobs running outside web requests |
| Databases | PostgreSQL and MariaDB read replicas | Read queries, taken off the primary database |
All three use the settings described earlier: scale-up and scale-down thresholds for CPU or memory, an evaluation period, a cooldown window, and minimum and maximum instance counts. Autoscaling can be set up separately for each environment, from the Console's Configure resources tab or with the upsun autoscaling:set command.
Our guide Horizontal vs vertical scaling explained lists the default values. Upsun Cloud's triggers are average CPU and average memory, so request counts and queue length aren't used.
The database layer is where this differs from app-only autoscaling. Read replicas are defined in .upsun/config.yaml as postgresql-replica or mariadb-replica services linked to the primary, and Upsun Cloud adjusts how many are running without a redeployment. According to the docs:
- Your app is responsible for sending read queries to the replica connection, while writes keep going to the primary. The primary itself is sized manually.
- Replication is asynchronous, so a replica can be a few milliseconds behind the primary.
The Console shows alerts when a threshold is crossed and a record of each scaling action, and the same events appear on the command line as environment.alert and environment.resources.update. You can attach an activity script to those events to send a Slack message or an email when scaling happens.
For the story behind read replica autoscaling, see Native, full-stack autoscaling on Upsun and PostgreSQL and MariaDB autoscaling: how full-stack autoscaling closes the database gap. For every setting, see autoscaling in the Upsun docs.
Frequently asked questions (FAQ)
What is the difference between autoscaling and load balancing?
A load balancer spreads incoming requests across the copies of an app that are already running. Autoscaling changes how many copies are running. They work together: autoscaling adds a copy, and the load balancer starts sending it traffic.
Does autoscaling save money?
It can. Instead of paying for peak capacity all day, you pay for extra capacity only while it's needed. Savings depend on how much your traffic varies. For steady, predictable traffic, a fixed number of well-sized instances can cost about the same.
How fast does autoscaling react?
It depends on the settings. With a 5-minute evaluation period, autoscaling waits for a signal to stay high for 5 minutes before adding capacity, plus however long a new copy takes to start. For a sudden spike, a higher minimum or a scheduled increase can bridge that gap.
Can a database autoscale?
Partly. Read replicas can be added and removed automatically to handle read queries. Writes still go to a single primary database, which is usually resized by hand.
Is autoscaling the same as serverless?
No, though they're related. Serverless platforms run code on demand and scale it for you, often down to zero when nothing is running. Autoscaling adjusts a pool of always-running app copies within limits you set.
Should I turn on autoscaling in preview environments?
Usually it's only worth it if you're load testing. Previews usually see light traffic, so a single small instance is enough.
Sources
- Autoscaling, Upsun docs
- PostgreSQL read-only replication, Upsun docs
- MariaDB read-only replication, Upsun docs
- Native, full-stack autoscaling on Upsun, Upsun blog
- Autoscaling deep dive, Upsun Developer Center
Deploy possibility.
Try Upsun for free.
Stay updated
Upsun Cloud: compliant and validated